Prologue: Why place an order when I can use the API?
Historical forecasts are only available via custom report. Price varies based on the report request properties. Report requests are invoiced separately from subscriptions, and a user's subscription level has no impact on pricing. As such, it is not required to be enrolled in a paid plan to use this feature.
Hourly historical forecasts include 48 hour forecast data from both the hourly forecast API, and the hourly air forecast quality API.
Daily historical forecasts include 16 day/daily data from the daily forecast API.
Placing An Order
To place an order for a custom historical data report:
- Navigate to the account dashboard, and select the "Historical Forecast Order" tab on the left.
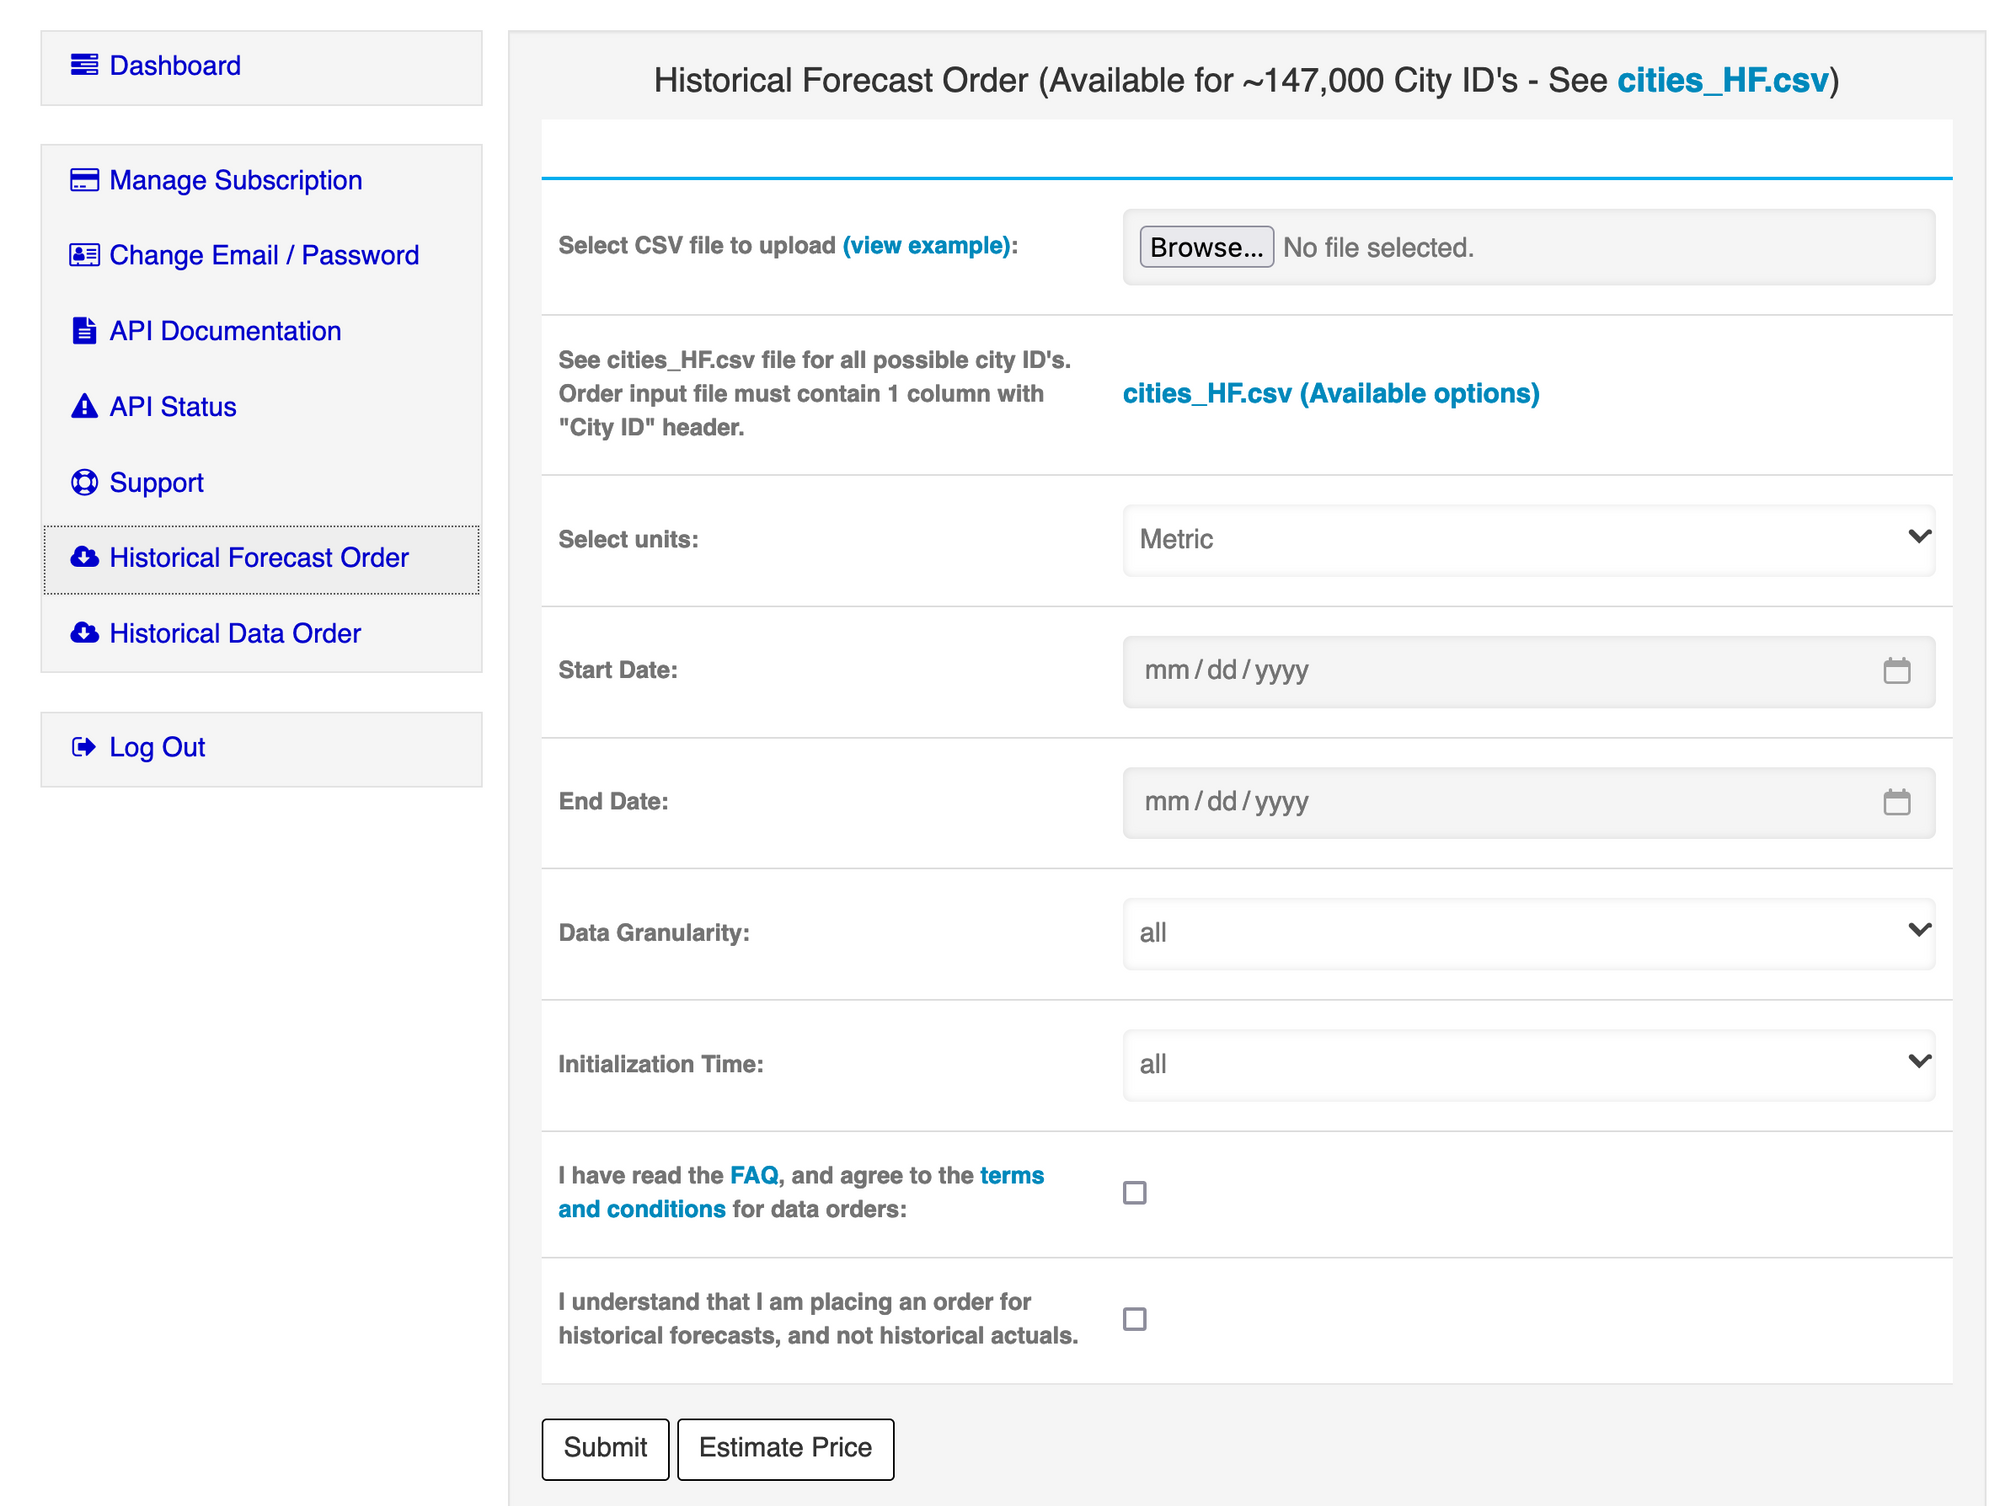
- Upload a CSV file containing the header "City ID" and one city ID per line. Not every City ID in our database is supported. Please refer to the cities_HF.csv file for all available options. This list includes a selected set of city points (about 147,000 total).
| Input Data Type | Example Upload File (csv) |
|---|---|
| City ID | file |
- Select the output units (Metric = celsius, m/s, mm, km or Imperial = fahrenheit, mph, in, miles).
- Select the date range of the output data - "Start Date", and "End Date".
- Select the initialization time of the forecasts (00z, 12z, or all). 00z is equivalent to 00:00 UTC. Initialization time is the approximate time the forecast was generated on the date specified. For example: a 48 hour forecast initialized at 00z will have 48 hour columns starting at 01:00-03:00 UTC. Please note that due to the running time of forecast generation, the first timestamp may be +1-3 hours of the initialization time.
- Select the granularity of the output data (daily, hourly, or both).
- Agree to the terms and conditions.
- Select "Estimate Price". This will validate all of your inputs, and provide you with both an estimate for the price as well as the estimated time the report will take to finish.
- At this point you can modify your inputs, and use the "Estimate Price" button to update your estimate.
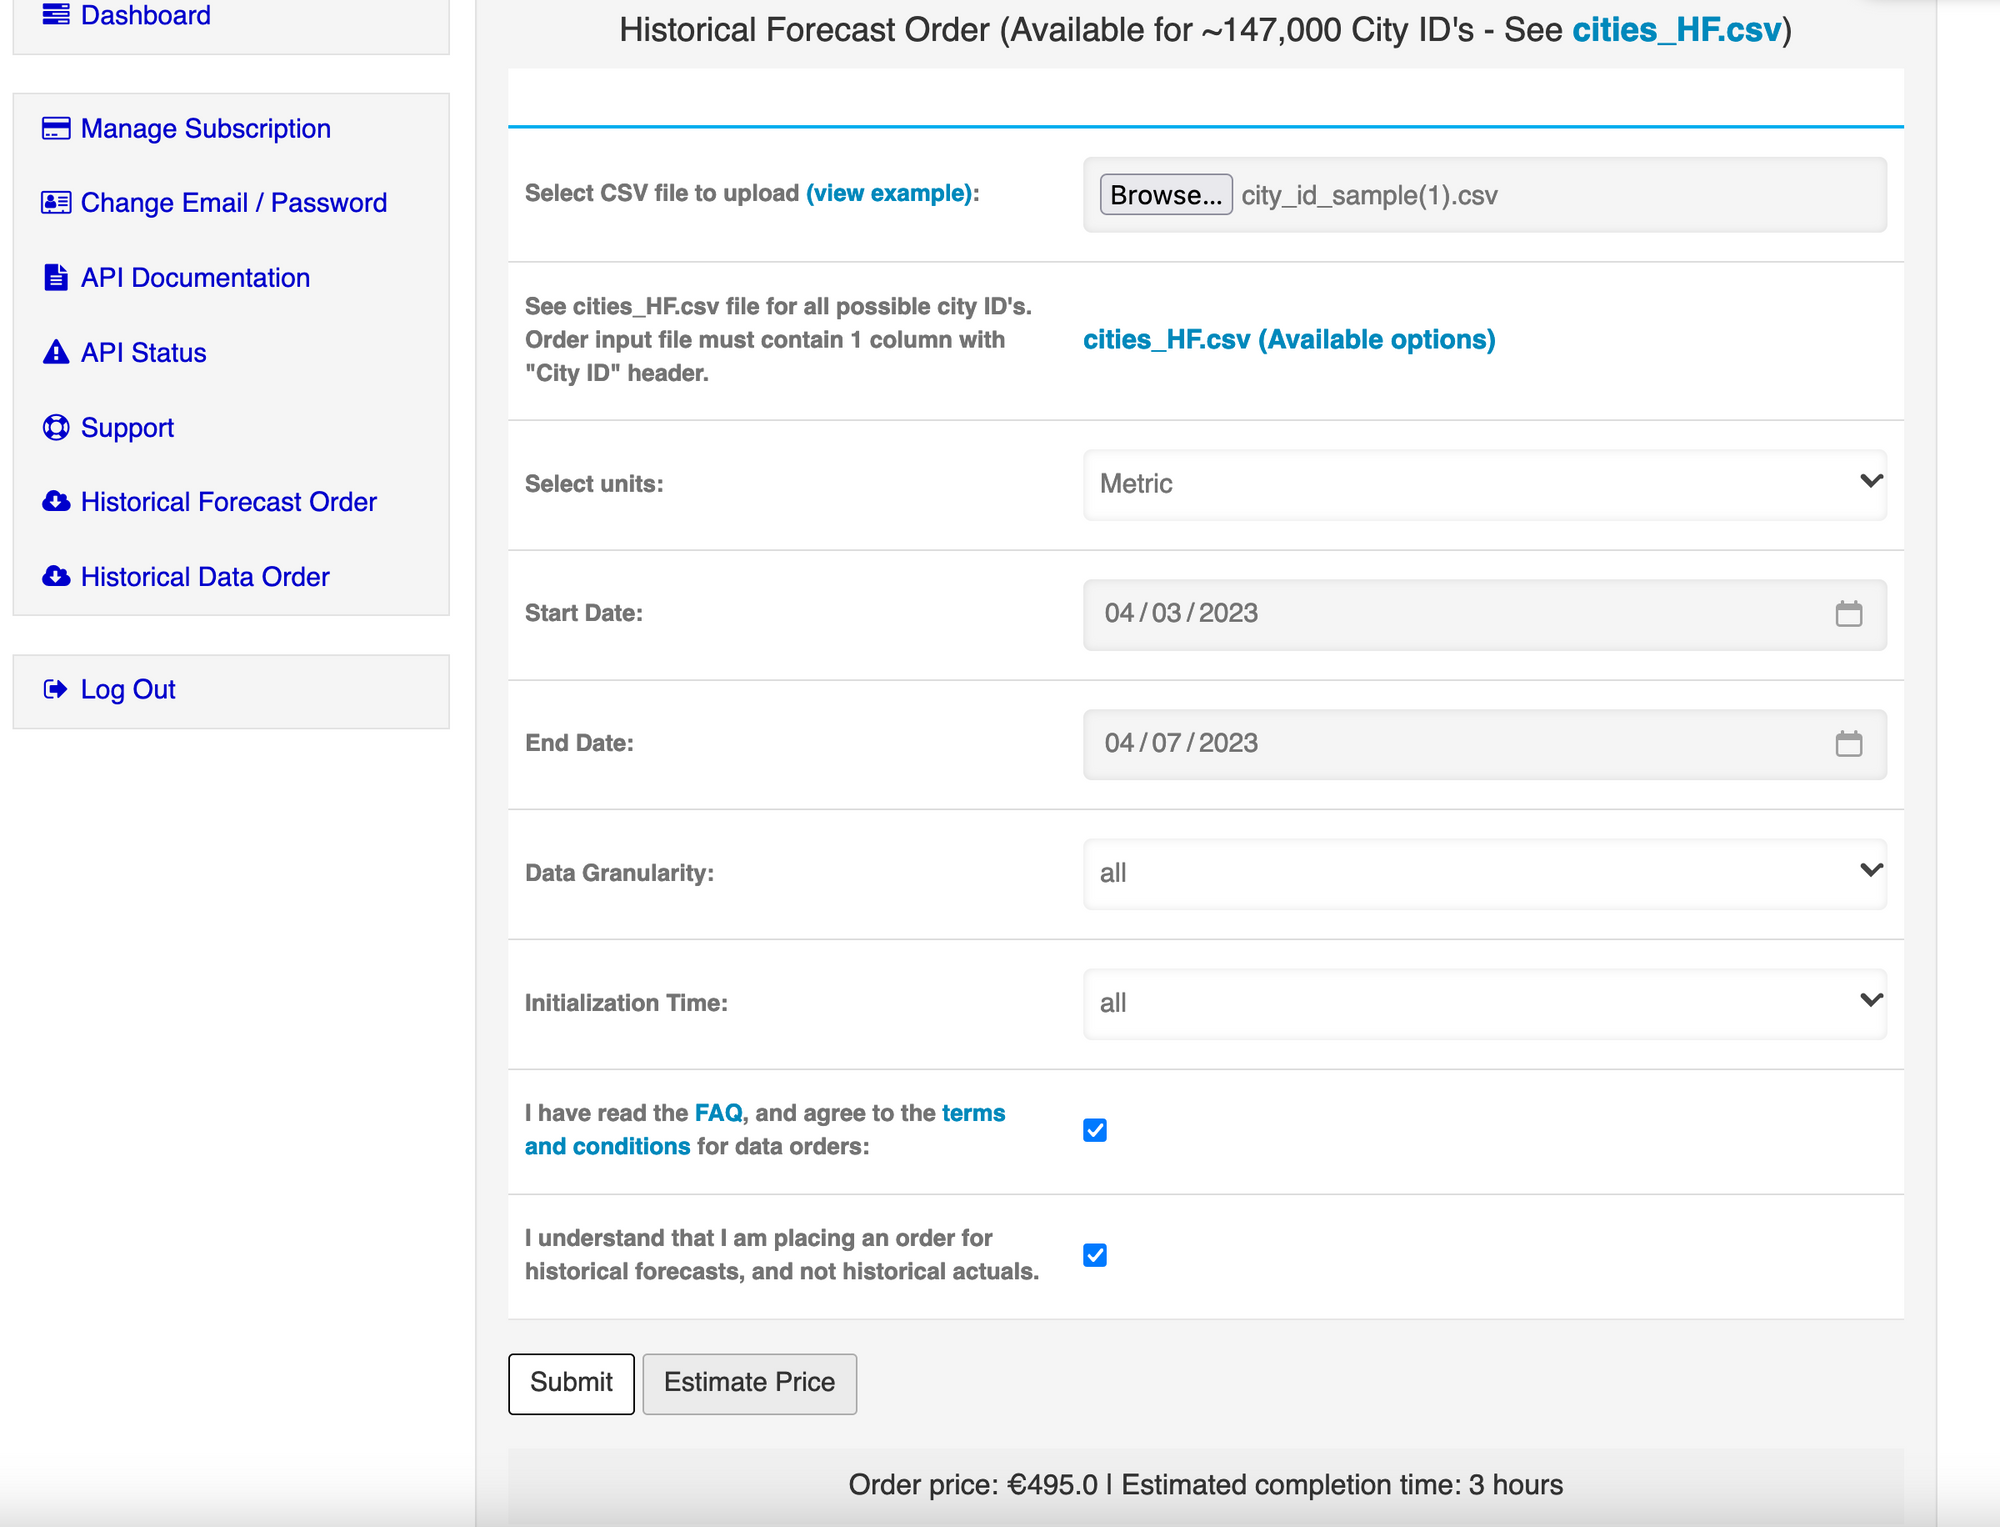
- Once you find a set of inputs you are satisfied with, select the "Submit" button. Once finished, you can find your invoice link. Additionally, the invoice will be sent to the primary email on the account. Once this invoice is paid, the report will enter a "Processing" state.
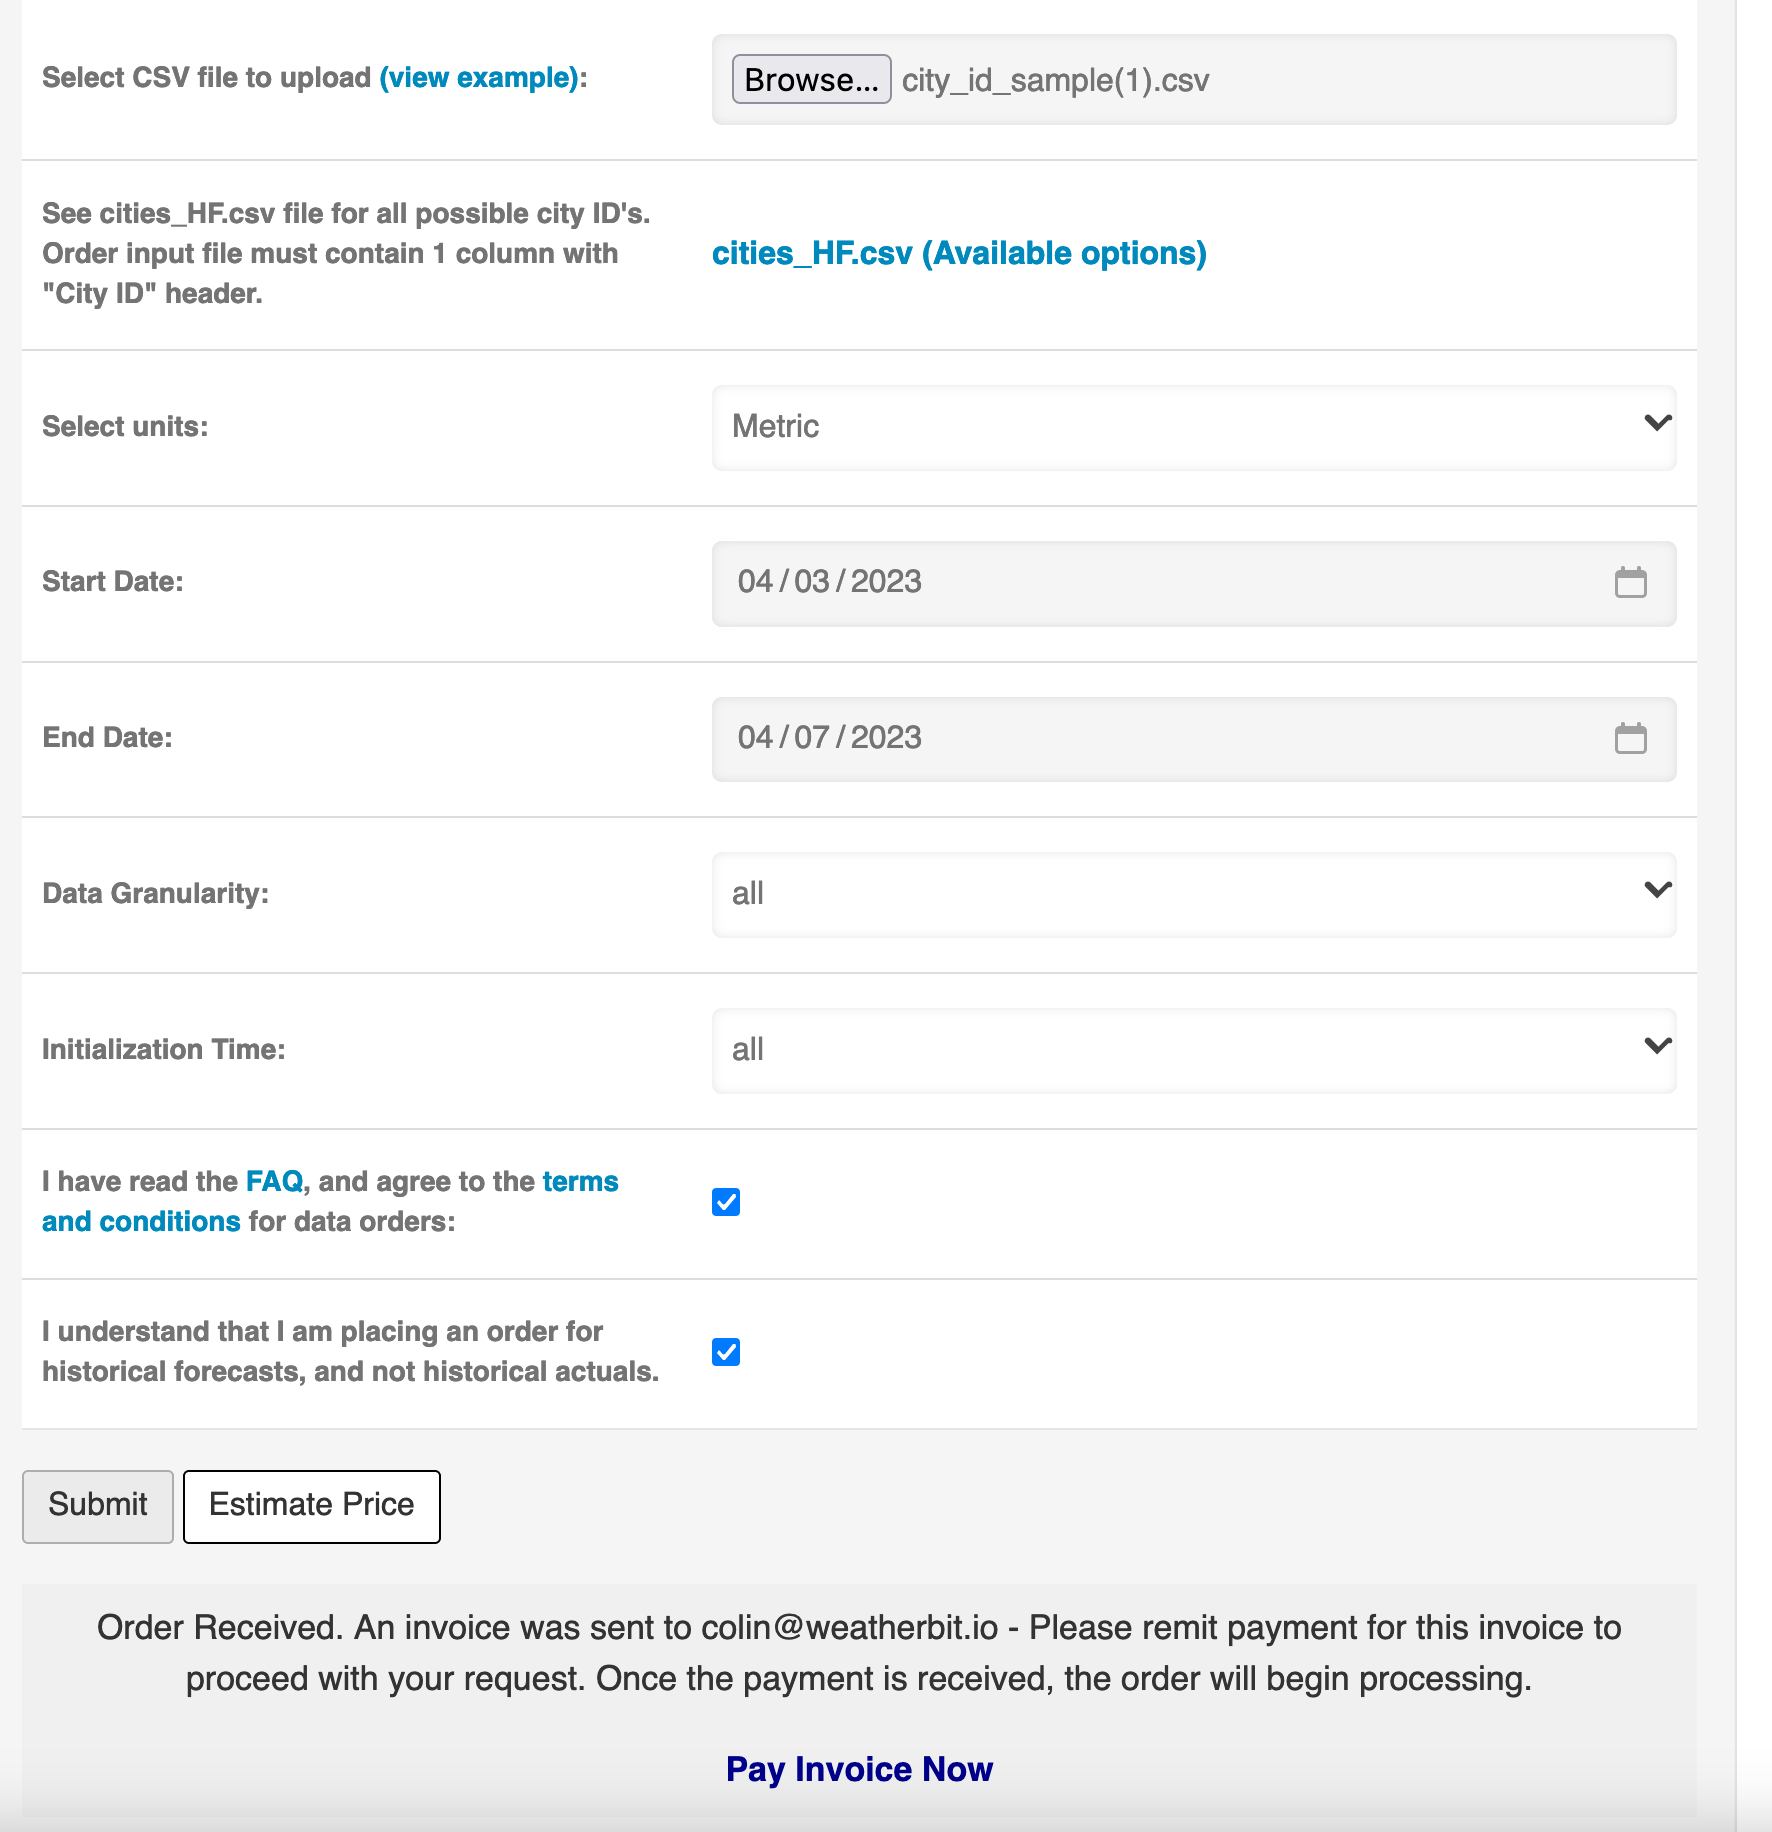
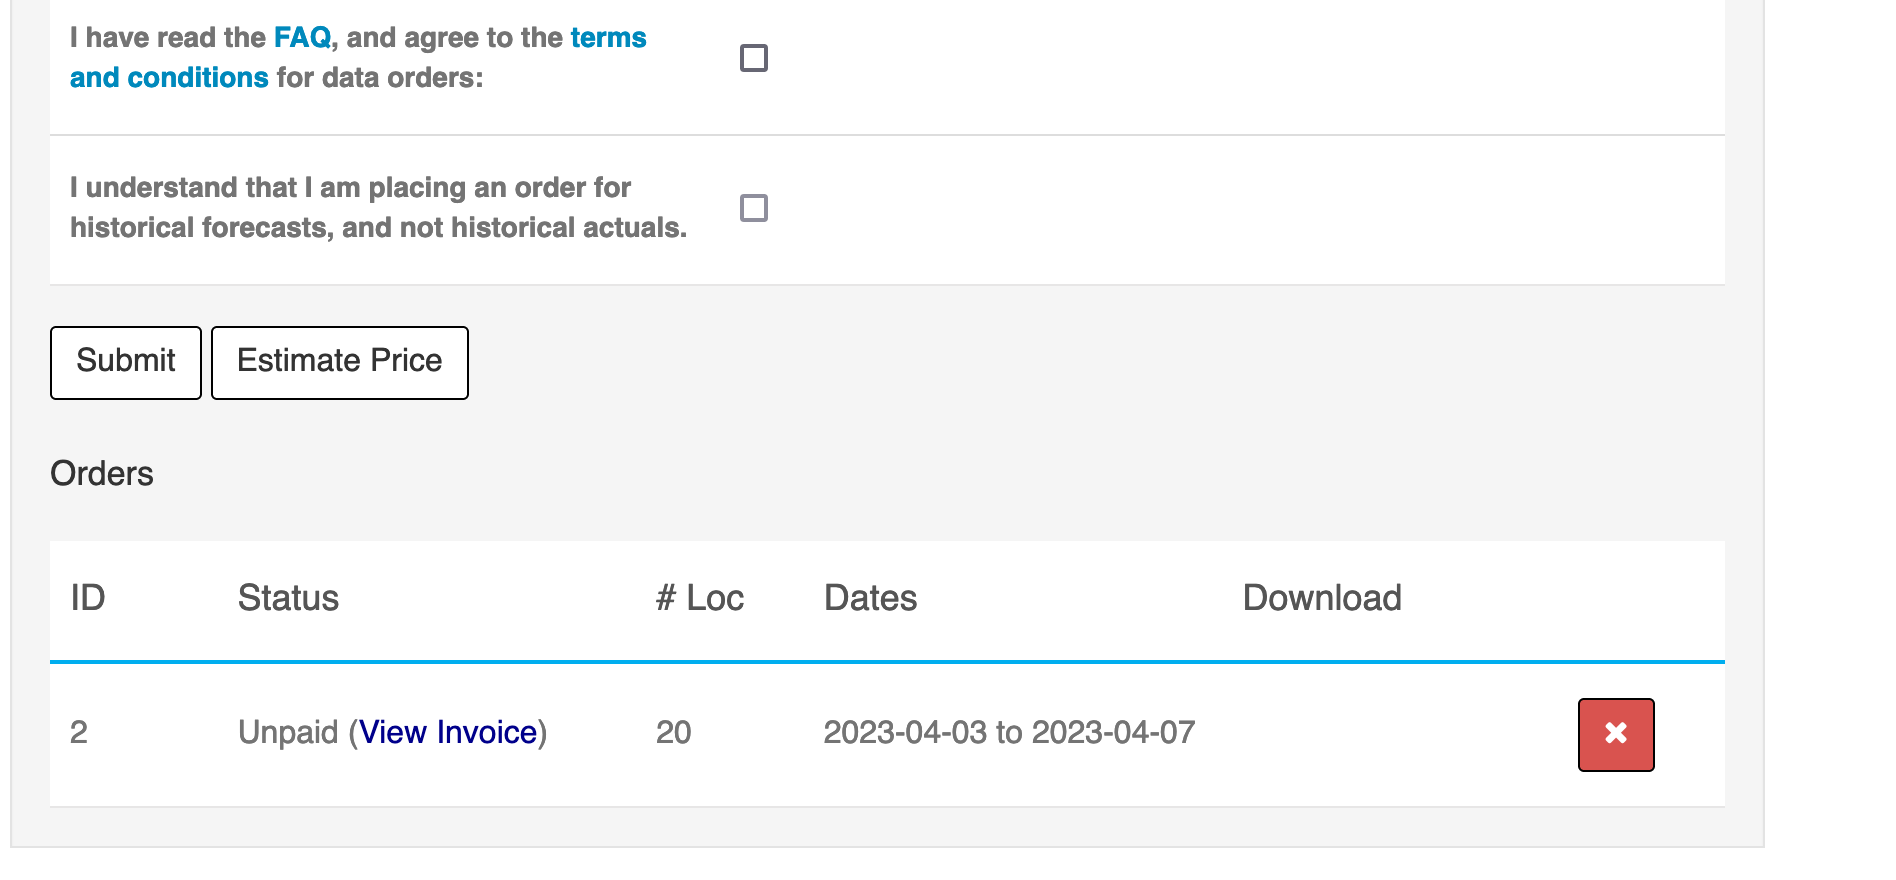
- If you did not receive this email, or you lost the original link supplied - you can simply revisit the "Historical Data Order" tab in the dashboard. Scroll down, and you will find your orders, as well as invoice links.
Downloading Your Report:
- Once your order is ready, you will receive an email with a download link, as well as the AWS S3 bucket it is hosted in. (Example bucket name: s3://order-10-d701cff2d96411edac4908c0eb1eo06a )
| Input Data Type | Example Report Files |
|---|---|
| Custom ID | historical_forecast_order.tar.gz |
- The file will be a Gzipped Tarball archive (tar.gz).
- You can download it either via the http link provided in the dashboard, or with the aws cli.
aws s3 cp s3://BUCKET_NAME/historical_forecast_order.tar.gz .- tar.gz files can be decompressed with most standard compression libraries like 7Zip
- Or you can unpack it with the following command:
tar -xzf historical_forecast_order.tar.gz- Then decompress the contents with:
gunzip *
- Each file inside the tarball will be named according to the following convention forecast_{selected granularity}_{initialization_time}_result.csv

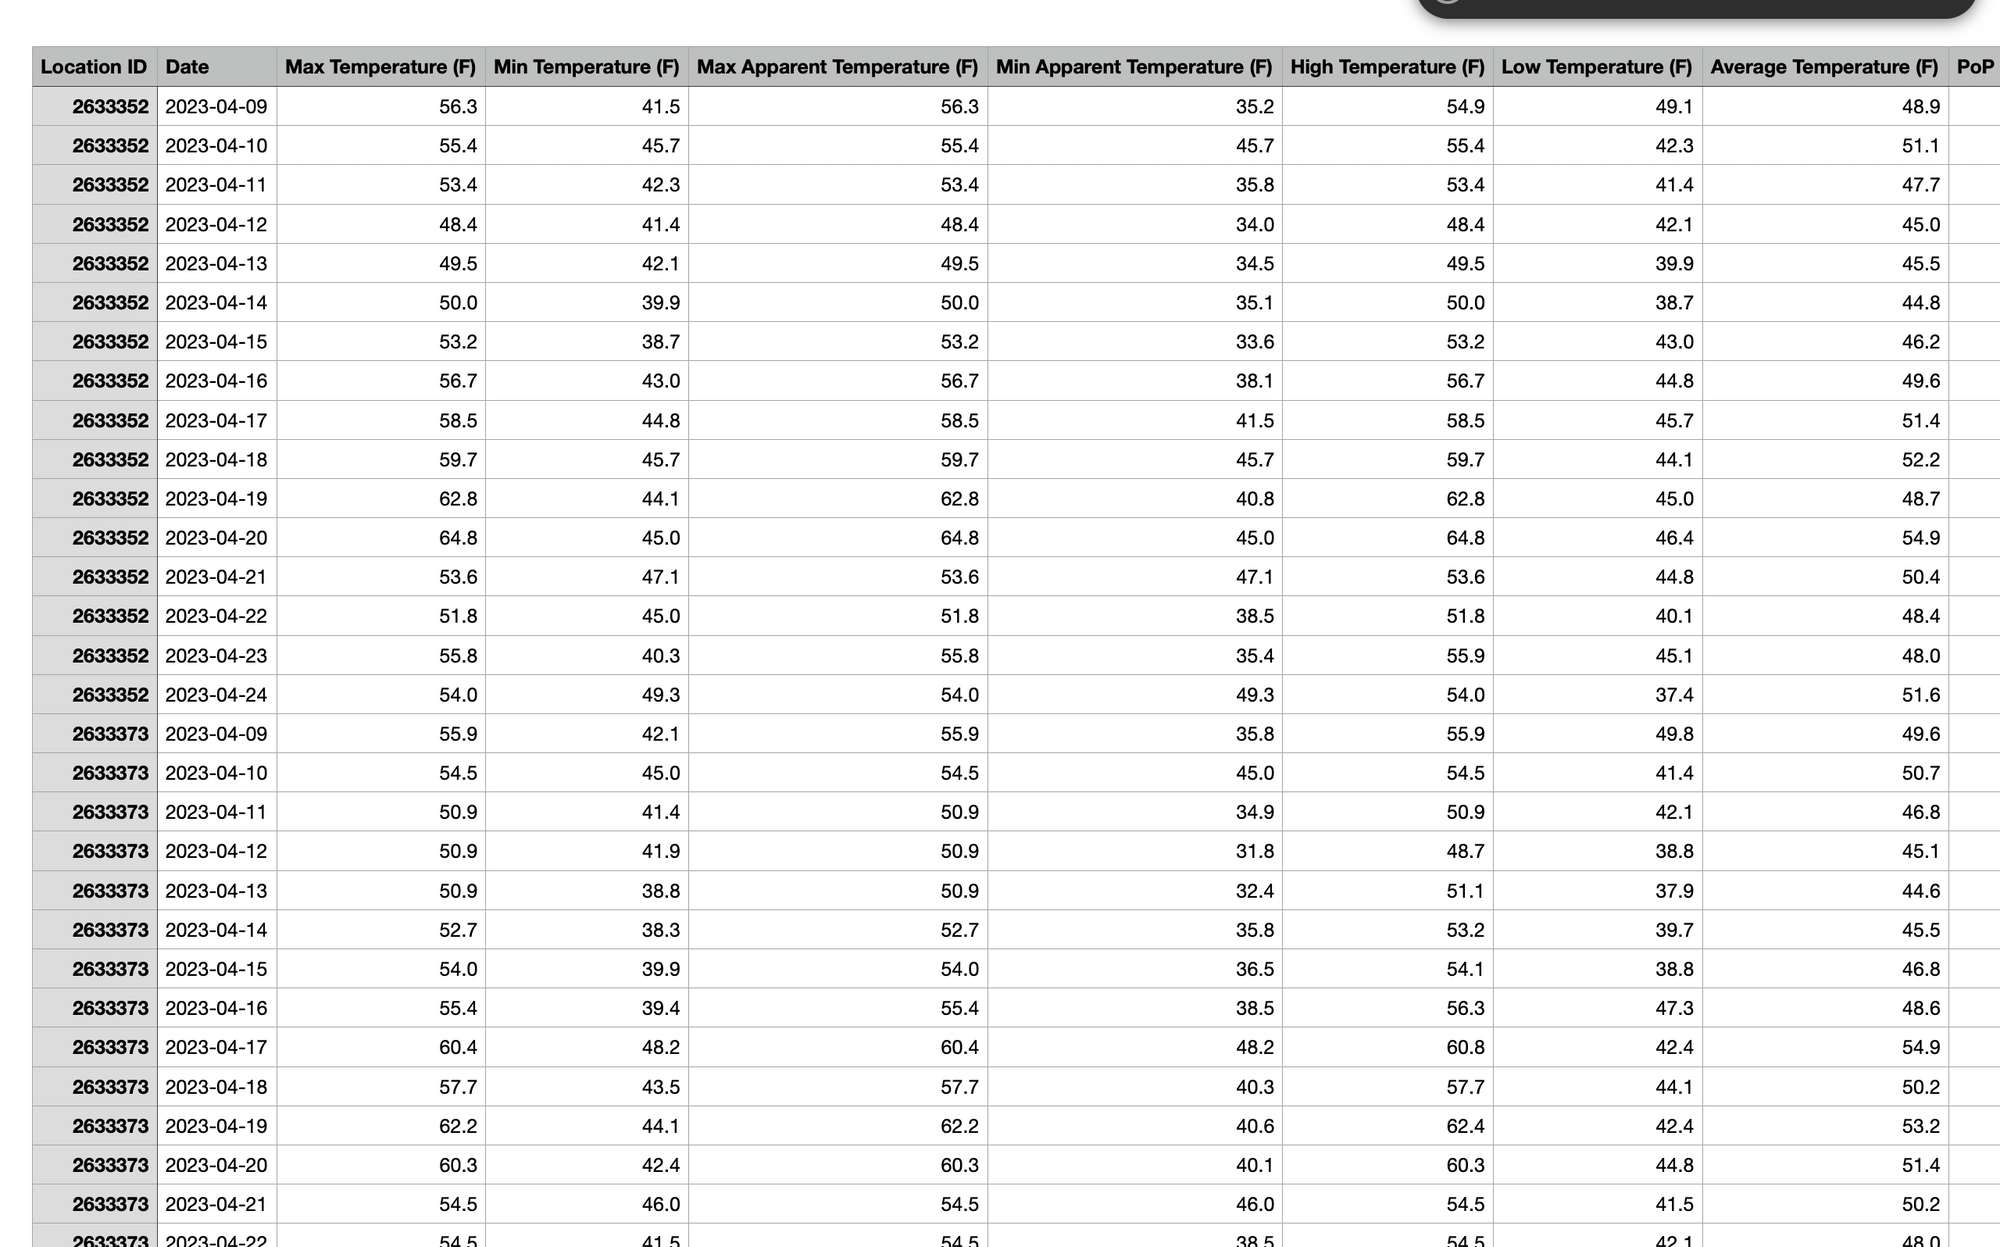
- Please note that the "Location ID" field will match the "City ID" provided in your input files. They are equivalent.
Please note that your data files will be available for download for 30 days after the order is completed. After 30 days, they will be deleted.
Order Tips
- Historical forecast data is stored in a cold archive, and organized such that it is much more computationally expensive to select large date ranges. Conversely, it is optimized for selecting many locations at once.
- A report with many locations, and a short date range will yield a much less expensive report than a few locations with a large date range.
| # of Locations | # of Days | Init Time | Granularity | Price |
|---|---|---|---|---|
| 20 | 365 | all | all | $4,306 |
| 1000 | 365 | all | all | $6,656 |
| 20 | 30 | all | all | $538 |
| 1000 | 30 | all | all | $2,888 |
- You can further reduce the price by selecting only one initialization time, and/or granularity.
| # of Locations | # of Days | Init Time | Granularity | Price |
|---|---|---|---|---|
| 20 | 365 | 00z | daily | $2,225 |
| 1000 | 365 | 00z | daily | $4,375 |
| 20 | 30 | 00z | daily | $350 |
| 1000 | 30 | 00z | daily | $2,700 |
Known Issues
- Unavailable hourly, and daily forecasts for 00z May 30th, 2023.
- Unavailable hourly, and daily forecasts for 00z September 23rd, 2023.
- Unavailable hourly, and daily forecasts April 5th - April 16th, 2025.